Independent writing on tax-smart planning, mortgage strategy, and retirement building. For Canadian professionals who want the whole picture, not just a piece of it.
The Rental Property Spreadsheet Leaves Out $47,000: A Real Comparison Using Toronto Numbers
Samantha, a 39-year-old cardiologist in Toronto, recently forwarded me a spreadsheet her mortgage broker prepared. It showed a $950,000 one-bedroom condo in Liberty Village generating $2,650 per month in rent, appreciating at 4% annually, with mortgage paydown building equity. The conclusion, in bold: $480,000 in net wealth over 20 years. The same down payment in a balanced ETF portfolio, the broker claimed, would return about $390,000. Real estate wins by $90,000.
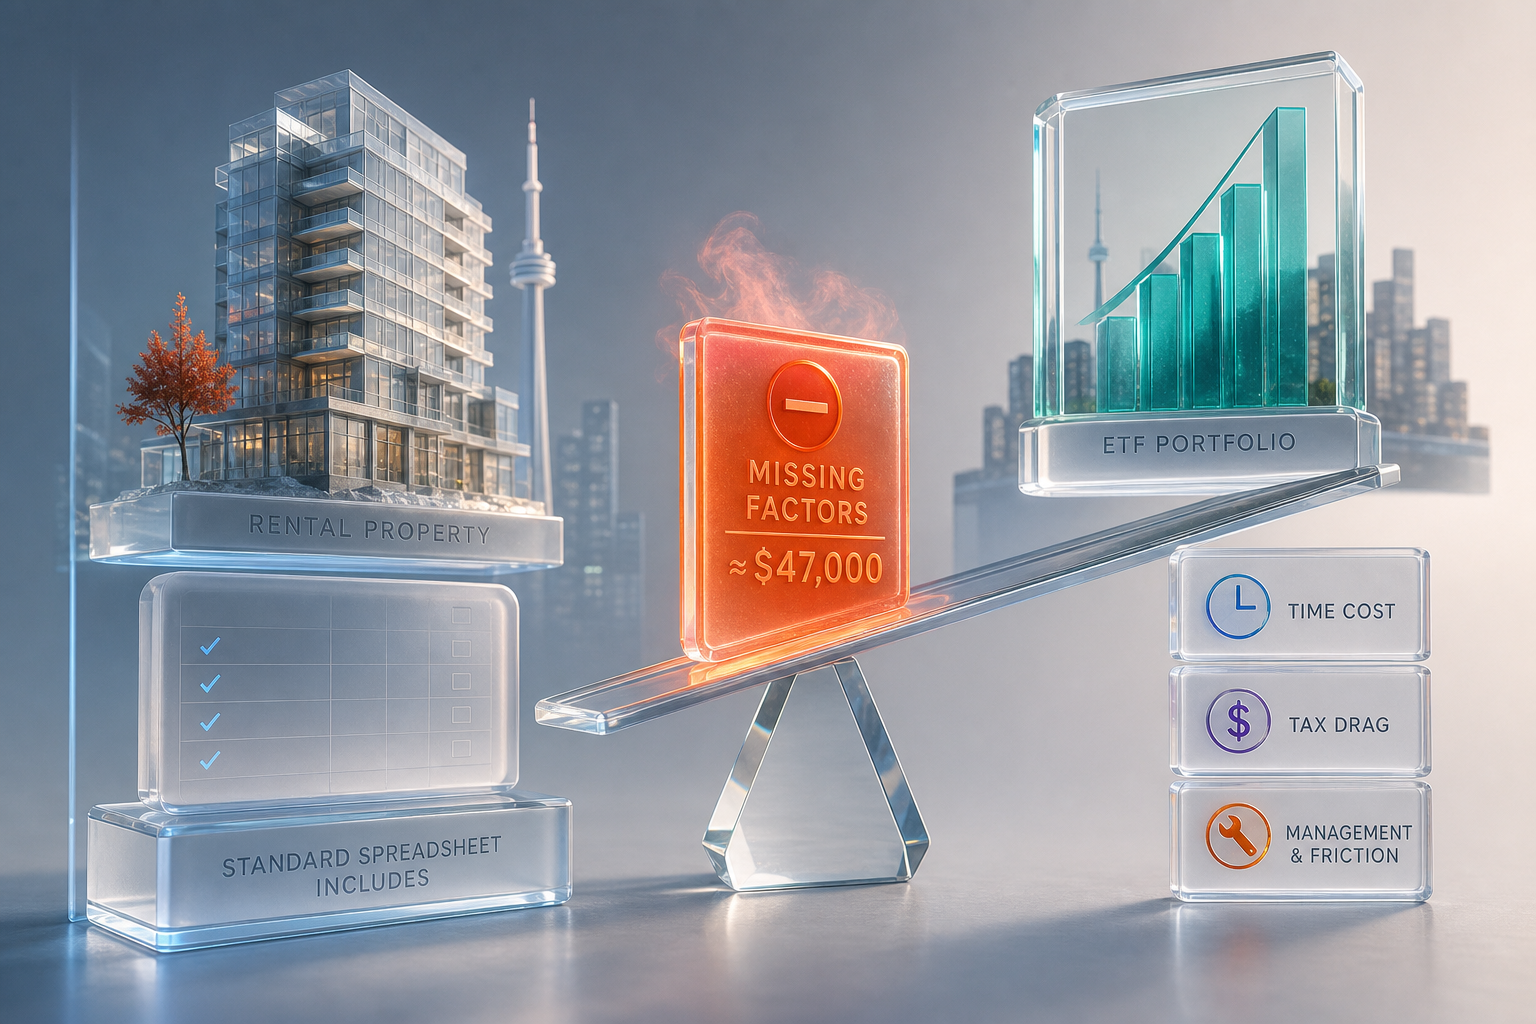
The broker's math wasn't wrong. It was incomplete. When we added the variables missing from the model, ones that show up in bank statements but not in projections, the rental property's advantage disappeared. The portfolio scenario ended up ahead by roughly $47,000 over the same horizon, and that gap widens when you price Samantha's time at her actual billing rate.
Here's what the standard rental analysis includes, what it leaves out, and where the inflection point actually sits for someone in Samantha's tax bracket.
The Baseline Case: What the Spreadsheet Shows
Samantha's scenario uses a 20% down payment ($190,000), a 25-year mortgage at 5.1%, and monthly carrying costs of $4,100 (mortgage, property tax, condo fees). Rent of $2,650 leaves a $1,450 monthly shortfall, which Samantha covers from her professional income. That shortfall is real cash out the door every month, totaling $348,000 over twenty years.
The offsetting gains: mortgage principal paydown accumulates $310,000 in equity. Property appreciation at 4% nominal adds another $1.07 million in value. Subtract the remaining mortgage balance and transaction costs, and the net position after sale is approximately $670,000. Subtract the original down payment and the cumulative negative cash flow, and you're left with $132,000 in net wealth.
That's the first number. The portfolio comparison starts with the same $190,000 down payment, adds the $1,450 monthly shortfall as ongoing contributions, and assumes 6% nominal return (4% real plus 2% inflation, matching the property's appreciation assumption). After twenty years, compounded, the portfolio is worth $826,000. Net wealth: $178,000.
Portfolio wins by $46,000. But this still doesn't capture what rental ownership actually costs.
The Hidden Overhead: What Doesn't Appear in Year One Projections
Toronto land transfer taxes, provincial and municipal combined, add 3.9% to acquisition cost. On a $950,000 property, that's $37,000 upfront. Legal fees, inspections, and title insurance add another $4,000. None of this is recoverable. The true starting capital is $231,000, not $190,000.
On the exit, realtor commissions at 4% total, legal fees, and staging typically consume 5% of the sale price. On a projected $2.07 million sale in 2044, that's $103,500 gone before net proceeds hit the account.
Now add operating expenses. The broker's model budgeted $150 per month for maintenance. According to REIN (Real Estate Investment Network), realistic annual maintenance for a condo in the GTA averages 1% to 1.5% of property value. On a $950,000 condo, that's $950 to $1,425 per month, not $150. Condo fees will escalate. Special assessments happen. A kitchen or bathroom refresh every 10 to 12 years to keep the unit competitive is another $20,000 to $30,000.
Vacancy and tenant turnover matter. If the unit sits empty for one month every three years, conservative for Toronto, that's 0.56% annual vacancy drag. On this property, that's an additional $15,900 per month every third year in lost rent. Property management, if Samantha outsources it, runs 8% to 10% of gross rent plus placement fees. At 9%, that's $238.50 per month.
Finally, there's the tax friction that most models ignore. Rental income is taxed at Samantha's marginal rate, which in Ontario at her income level is approximately 53%. Her $2,650 monthly rent, after expenses but before mortgage interest, generates taxable income. Even with deductions for interest and a portion of property tax, she's paying tax on phantom income in years when cash flow is negative. The portfolio, by contrast, generates mostly unrealized capital gains (taxed at 50% inclusion below $250,000, or 66.7% above), and dividends benefit from the Dividend Tax Credit. The portfolio's tax efficiency is structurally higher.
When you layer in realistic maintenance, vacancy, management, entry and exit costs, the rental's net position drops to approximately $85,000 over twenty years. The portfolio, adjusted for realistic return variance and tax drag on rebalancing, still sits near $178,000. The gap is now $93,000, and we haven't yet priced Samantha's time.
The Opportunity Cost No One Enters Into the Model
Samantha bills at $310 per hour. A rental property in Toronto, even with professional management, requires landlord involvement. Tenant screening, lease reviews, coordinating repairs, handling disputes, reviewing property manager reports, filing annual tax returns with rental schedules. Conservatively, 8 hours per month.
That's $29,760 per year in foregone income if Samantha could otherwise bill those hours. Over twenty years, even without discounting for time value, that's $595,200 in opportunity cost. You don't have to weight the full amount to see the implication: if Samantha spends even 15% of that time on rental administration instead of seeing patients, the rental decision costs her an additional $89,280.
The RRSP or TFSA portfolio requires one hour per year for rebalancing and tax filing. The spread isn't close.
When the Recommendation Flips
Three conditions tilt the analysis back toward real estate. First, when the investor's marginal tax rate is lower. Rental income taxed at 30% instead of 53% changes the cash flow math materially. Second, when the down payment is larger, say 40% or 50%, the negative monthly carry shrinks or disappears, and the leverage effect on appreciation dominates. Third, when the property qualifies for the Principal Residence Exemption. If Samantha lives in the condo for two years, then converts it to a rental, a portion of the eventual gain is sheltered. That changes the exit tax dramatically.
Real estate also wins if Toronto's specific supply constraints, greenbelt restrictions, low housing starts, immigration-driven demand, produce sustained appreciation above 4%. At 5.5% annual growth, the wealth delta flips back to favor the rental, assuming all other variables hold. But betting on sustained above-trend appreciation in a higher-for-longer rate environment is a different kind of wager.
For Samantha, the portfolio is the better financial decision by roughly $47,000 to $93,000, depending on how you weight time and model future appreciation. The rental property isn't a bad investment. It's a concentrated bet on a single asset, in a single postal code, with a single tenant, requiring active oversight, in exchange for leveraged exposure to Toronto residential real estate. The spreadsheet makes it look like passive income. The bank statements tell a different story.



Samantha, a 39-year-old cardiologist in Toronto, recently forwarded me a spreadsheet her mortgage broker prepared. It showed a $950,000 one-bedroom condo in Liberty Village generating $2,650 per month in rent, appreciating at 4% annually, with mortgage paydown building equity. The conclusion, in bold: $480,000 in net wealth over 20 years. The same down payment in a balanced ETF portfolio, the broker claimed, would return about $390,000. Real estate wins by $90,000.
The broker's math wasn't wrong. It was incomplete. When we added the variables missing from the model, ones that show up in bank statements but not in projections, the rental property's advantage disappeared. The portfolio scenario ended up ahead by roughly $47,000 over the same horizon, and that gap widens when you price Samantha's time at her actual billing rate.
Here's what the standard rental analysis includes, what it leaves out, and where the inflection point actually sits for someone in Samantha's tax bracket.
The Baseline Case: What the Spreadsheet Shows
Samantha's scenario uses a 20% down payment ($190,000), a 25-year mortgage at 5.1%, and monthly carrying costs of $4,100 (mortgage, property tax, condo fees). Rent of $2,650 leaves a $1,450 monthly shortfall, which Samantha covers from her professional income. That shortfall is real cash out the door every month, totaling $348,000 over twenty years.
The offsetting gains: mortgage principal paydown accumulates $310,000 in equity. Property appreciation at 4% nominal adds another $1.07 million in value. Subtract the remaining mortgage balance and transaction costs, and the net position after sale is approximately $670,000. Subtract the original down payment and the cumulative negative cash flow, and you're left with $132,000 in net wealth.
That's the first number. The portfolio comparison starts with the same $190,000 down payment, adds the $1,450 monthly shortfall as ongoing contributions, and assumes 6% nominal return (4% real plus 2% inflation, matching the property's appreciation assumption). After twenty years, compounded, the portfolio is worth $826,000. Net wealth: $178,000.
Portfolio wins by $46,000. But this still doesn't capture what rental ownership actually costs.
The Hidden Overhead: What Doesn't Appear in Year One Projections
Toronto land transfer taxes, provincial and municipal combined, add 3.9% to acquisition cost. On a $950,000 property, that's $37,000 upfront. Legal fees, inspections, and title insurance add another $4,000. None of this is recoverable. The true starting capital is $231,000, not $190,000.
On the exit, realtor commissions at 4% total, legal fees, and staging typically consume 5% of the sale price. On a projected $2.07 million sale in 2044, that's $103,500 gone before net proceeds hit the account.
Now add operating expenses. The broker's model budgeted $150 per month for maintenance. According to REIN (Real Estate Investment Network), realistic annual maintenance for a condo in the GTA averages 1% to 1.5% of property value. On a $950,000 condo, that's $950 to $1,425 per month, not $150. Condo fees will escalate. Special assessments happen. A kitchen or bathroom refresh every 10 to 12 years to keep the unit competitive is another $20,000 to $30,000.
Vacancy and tenant turnover matter. If the unit sits empty for one month every three years, conservative for Toronto, that's 0.56% annual vacancy drag. On this property, that's an additional $15,900 per month every third year in lost rent. Property management, if Samantha outsources it, runs 8% to 10% of gross rent plus placement fees. At 9%, that's $238.50 per month.
Finally, there's the tax friction that most models ignore. Rental income is taxed at Samantha's marginal rate, which in Ontario at her income level is approximately 53%. Her $2,650 monthly rent, after expenses but before mortgage interest, generates taxable income. Even with deductions for interest and a portion of property tax, she's paying tax on phantom income in years when cash flow is negative. The portfolio, by contrast, generates mostly unrealized capital gains (taxed at 50% inclusion below $250,000, or 66.7% above), and dividends benefit from the Dividend Tax Credit. The portfolio's tax efficiency is structurally higher.
When you layer in realistic maintenance, vacancy, management, entry and exit costs, the rental's net position drops to approximately $85,000 over twenty years. The portfolio, adjusted for realistic return variance and tax drag on rebalancing, still sits near $178,000. The gap is now $93,000, and we haven't yet priced Samantha's time.
The Opportunity Cost No One Enters Into the Model
Samantha bills at $310 per hour. A rental property in Toronto, even with professional management, requires landlord involvement. Tenant screening, lease reviews, coordinating repairs, handling disputes, reviewing property manager reports, filing annual tax returns with rental schedules. Conservatively, 8 hours per month.
That's $29,760 per year in foregone income if Samantha could otherwise bill those hours. Over twenty years, even without discounting for time value, that's $595,200 in opportunity cost. You don't have to weight the full amount to see the implication: if Samantha spends even 15% of that time on rental administration instead of seeing patients, the rental decision costs her an additional $89,280.
The RRSP or TFSA portfolio requires one hour per year for rebalancing and tax filing. The spread isn't close.
When the Recommendation Flips
Three conditions tilt the analysis back toward real estate. First, when the investor's marginal tax rate is lower. Rental income taxed at 30% instead of 53% changes the cash flow math materially. Second, when the down payment is larger, say 40% or 50%, the negative monthly carry shrinks or disappears, and the leverage effect on appreciation dominates. Third, when the property qualifies for the Principal Residence Exemption. If Samantha lives in the condo for two years, then converts it to a rental, a portion of the eventual gain is sheltered. That changes the exit tax dramatically.
Real estate also wins if Toronto's specific supply constraints, greenbelt restrictions, low housing starts, immigration-driven demand, produce sustained appreciation above 4%. At 5.5% annual growth, the wealth delta flips back to favor the rental, assuming all other variables hold. But betting on sustained above-trend appreciation in a higher-for-longer rate environment is a different kind of wager.
For Samantha, the portfolio is the better financial decision by roughly $47,000 to $93,000, depending on how you weight time and model future appreciation. The rental property isn't a bad investment. It's a concentrated bet on a single asset, in a single postal code, with a single tenant, requiring active oversight, in exchange for leveraged exposure to Toronto residential real estate. The spreadsheet makes it look like passive income. The bank statements tell a different story.
Read Next
Ottawa Can Win Against Cleveland-Cliffs and Still Lose on Steel Tariffs
143,929 Approved Homes Sit Unbuilt: What Is Really Holding Back Canada's Supply
Northeastern PA or the Big City: What the Same Budget Buys in Each
7 Co-Ownership Agreements That Protect Both the Friendship and the Equity